AIOps Platform Architecture: Core Components, Design Patterns, and Security
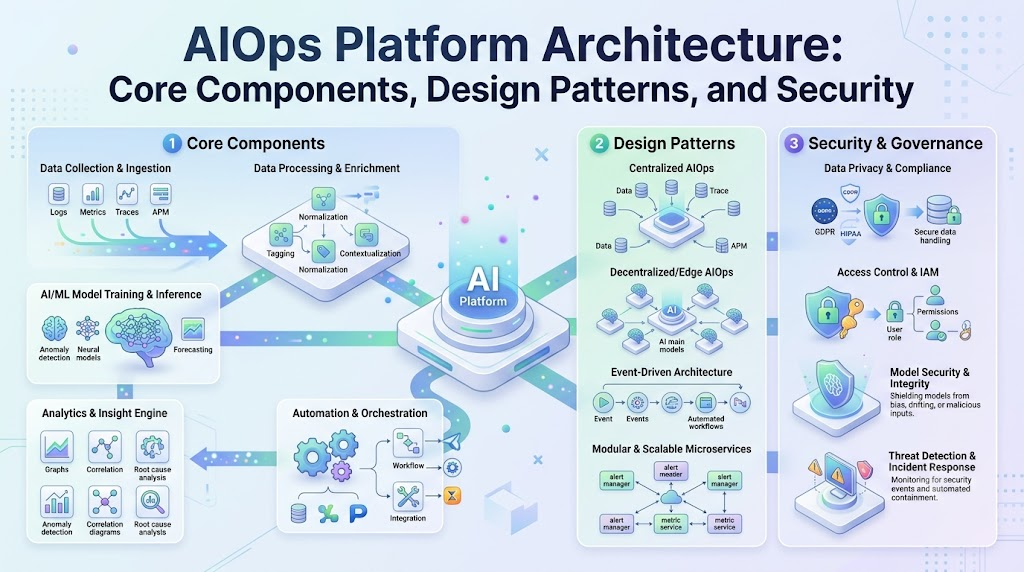
Introduction
Enterprise software infrastructure has expanded past the limits of human-driven monitoring. Microservice deployments, dynamic serverless functions, and distributed cloud topologies produce millions of operational data points every minute. During a service disruption, IT teams are routinely overwhelmed by cascading notifications, turning incident response into a search for a needle in an ever-growing haystack.
Tackling this complexity requires moving beyond passive dashboards and static threshold checks. An enterprise AIOps architecture—the structural foundation behind Artificial Intelligence for IT Operations—restructures how operations teams interact with system state data. By transforming raw telemetry into contextual insights, filtering noise, and automating routine operational tasks, a well-planned architecture helps engineers maintain high service availability.
This guide outlines the layered design, core data workflows, practical use cases, and governance patterns required to architect a robust AIOps ecosystem in production.
Rethinking IT Operations Through AIOps
AIOps integrates data analytics, machine learning algorithms, and workflow orchestration into a cohesive operational engine. Rather than replacing existing monitoring tools, an AIOps layer acts as an intelligence aggregator across your infrastructure stack, surfacing hidden relationships between disparate system components.
Traditional IT monitoring relies heavily on fixed, binary conditions (e.g., raise a flag if disk usage hits 80%). However, rigid boundaries fail in dynamic environments where resource demands fluctuate naturally. A harmless traffic surge can trigger dozens of false alerts, while subtle, multi-system latency increases remain unnoticed until services crash.
An effective AIOps deployment alters this operational dynamic:
- Signal Extraction: Suppresses repetitive notification storms to isolate true operational anomalies.
- Topology Context: Maps dependencies dynamically across evolving cloud and container environments.
- Guided Triage: Links relevant logs, trace spans, and metric shifts to give engineers immediate visibility into failure root causes.
- Targeted Automation: Executes safe, well-defined operational scripts to resolve recurring issues without manual intervention.
Key Layers of an AIOps Architecture
Designing an enterprise AIOps ecosystem requires a modular approach where each layer handles a distinct stage of the telemetry processing lifecycle.
+-----------------------------------------------------------------------+
|                    Execution & Action Orchestration                   |
|       (Automation Engines, CI/CD, ITSM, Messaging & On-Call)          |
+-----------------------------------------------------------------------+
                                   ^
                                   |
+-----------------------------------------------------------------------+
|                     Algorithmic Analytics Engine                      |
|   (Statistical Baselines, Event Clustering, Topology-Aware RCA)       |
+-----------------------------------------------------------------------+
                                   ^
                                   |
+-----------------------------------------------------------------------+
|                   Data Normalization & Enrichment                     |
|     (Parsing, Deduplication, Metadata Tagging, Storage Indexing)      |
+-----------------------------------------------------------------------+
                                   ^
                                   |
+-----------------------------------------------------------------------+
|                     Ingestion & Telemetry Pipeline                    |
|       (OpenTelemetry, Log Collectors, Streaming Message Brokers)       |
+-----------------------------------------------------------------------+
                                   ^
                                   |
+-----------------------------------------------------------------------+
|                            Target Systems                             |
|   (Hybrid Cloud, K8s Clusters, APM Tools, Network Sensors, ITSM)      |
+-----------------------------------------------------------------------+
1. Ingestion & Telemetry Pipeline
The base layer is responsible for gathering operational signals across distributed systems continuously. High-performing architectures handle three main telemetry types alongside structural data:
- Time-Series Metrics: Numeric data measuring performance indicators over time (CPU utilization, request rates, memory consumption).
- System & Event Logs: Text streams generated by applications, infrastructure nodes, and security proxies detailing system activity.
- Distributed Traces: End-to-end paths of requests navigating through complex microservice architectures.
- Topology & Metadata: Live maps showing network connectivity, service dependencies, deployment environments, and Kubernetes pod states.
Using open standards like OpenTelemetry helps prevent vendor lock-in and simplifies multi-cloud data collection via unified agent frameworks.
2. Data Normalization & Enrichment
Raw system output arrives in various formats, timestamps, and structures. The normalization layer parses and standardizes this data, turning unorganized inputs into a clean, searchable data stream.
- Format Unification: Translates disparate log structures (JSON, Key-Value, plain Syslog) into a common operational schema.
- Deduplication: Merges identical error messages sent simultaneously by clustered application instances.
- Context Enrichment: Attaches critical metadata (environment IDs, application owner tags, recent CI/CD code deployments) to incoming signals.
3. Algorithmic Analytics Engine
This processing layer contains the machine learning models that extract operational meaning from enriched telemetry:
- Dynamic Anomaly Detection: Utilizes statistical baselines and time-series forecasting to adapt alert thresholds to cyclic usage patterns automatically.
- Event Correlation: Clusters related telemetry by analyzing temporal proximity, shared infrastructure topology, and log message similarities.
- Root-Cause Recommendation: Evaluates service dependency graphs to trace downstream application failures back to upstream infrastructure issues.
4. Execution & Action Orchestration
Insights must lead to practical operational decisions. The execution layer routes recommendations to administrative workflows and target delivery platforms:
- Targeted Notification: Delivers enriched incident cards directly to on-call schedules via Slack, Teams, or PagerDuty.
- ITSM Synchronization: Auto-populates and updates incident tickets within enterprise service desks like ServiceNow or Jira.
- Closed-Loop Remediation: Triggers pre-validated, automated scripts (e.g., recycling failed pods, clearing temp storage, or scaling instances) via secure webhooks or Ansible playbooks.
Core Analytical Capabilities in Action
Building an effective AIOps system requires applying specific analytics techniques to day-to-day operational challenges.
Dynamic Anomaly Detection vs. Static Thresholds
Static rules assume system behavior is constant. Setting a fixed threshold of Response Time > 300ms inevitably causes false alarms during peak shopping hours or missed alerts during low-traffic overnight periods.
AIOps platforms implement unsupervised learning algorithms (such as Isolation Forests or seasonal ARIMA models) to calculate moving operational baselines. The system learns the normal envelope for any specific hour, triggering alarms only when performance deviates significantly from expected historical patterns.
Algorithmic Noise Suppression
A single network link disruption can cause dozens of downstream services to fail health checks, triggering hundreds of individual alerts across monitoring tools.
To resolve alert storms, the correlation pipeline processes incoming alarms using three distinct techniques:
- Time-Window Grouping: Consolidates notifications occurring within a narrow, configurable time window.
- Dependency Mapping: Cross-checks signals against service maps to trace cascading errors back to a single component.
- Semantic Log Parsing: Applies Natural Language Processing (NLP) techniques to match error message signatures across different application logs.
This process compresses chaotic alert noise into a single structured incident report for on-call engineers.
Predictive Capacity Planning
Predictive analysis uses historical performance trends to identify system bottlenecks before they impact end users:
- Storage Consumption Projections: Linear regression models evaluate log growth rates, predicting when a disk volume will run out of space.
- Proactive Memory Analysis: Trend-line analysis detects slow memory leaks in long-running services, notifying engineers weeks before an out-of-memory crash occurs.
Position of AIOps in the Operations Ecosystem
AIOps complements existing engineering practices rather than replacing established operational frameworks.
| Operational Discipline | Core Objective | Typical Inputs & Tools | Primary Focus |
| Traditional IT Operations | Infrastructure stability and reactive maintenance. | Static alerts, SNMP traps, basic monitoring dashboards. | Maintaining host uptime and responding to threshold alerts. |
| DevOps | Speeding up software delivery and integration. | Version control, CI/CD pipelines, IaC tools. | Accelerating safe, frequent code deployments. |
| Site Reliability Engineering (SRE) | Building reliable, scalable software platforms. | SLO/SLI tracking, error budgets, runbook automation. | Minimizing toil and ensuring system resilience. |
| Observability | Exposing internal system state through telemetry output. | Metrics, unstructured logs, distributed trace spans. | Enabling manual debugging and exploratory system analysis. |
| AIOps | Applying intelligent analytics and correlation across systems. | Centralized telemetry, ML models, topology graphs. | Suppressing alert noise, accelerating triage, and driving automation. |
Operational Scenarios
Scenario 1: Resolving Cascading API Outages
A cloud application utilizes microservices connected to a shared database cluster.
- The Issue: A bad database query locks key tables, causing database response times to spike.
- Traditional Approach: Dozens of dependent API pods time out. Monitoring tools send over 80 independent alerts to separate engineering teams, leaving on-call staff to decipher which service caused the chain reaction.
- AIOps Approach: The correlation engine analyzes the timeline and service dependency graph. It suppresses the 79 downstream error alerts and opens a single critical ticket: “PostgreSQL lock contention causing cascading timeouts in Order Service.”
Scenario 2: Automated Storage Remediation
A stateful service cluster generates temporary log files during unexpected traffic bursts.
- The Issue: A sudden traffic influx threatens to fill disk capacity on critical nodes outside business hours.
- Traditional Approach: Disk usage crosses 90% at 2:00 AM, triggering an urgent wake-up page to an engineer, who must manually log in and clear temporary directories.
- AIOps Approach: The system detects the accelerated disk consumption rate and forecasts volume exhaustion within two hours. An automated runbook triggers, safely purging old temporary files and expanding the volume without requiring manual intervention.
Tooling Categories in Modern AIOps
AIOps ecosystems typically integrate tools across several operational domains rather than relying on a single monolith.
+-----------------------------------------------------------------------------------+
|                        AIOps Tooling Functional Domains                           |
+-----------------------------------------------+-----------------------------------+
| Domain                                        | Capability Profile                |
+-----------------------------------------------+-----------------------------------+
| Enterprise Observability Suites               | Full-stack metric collection, log |
| (Datadog, Dynatrace, New Relic)               | analytics, dynamic APM tracing.   |
+-----------------------------------------------+-----------------------------------+
| Event Correlation Platforms                   | Multi-source event aggregation,   |
| (BigPanda, Moogsoft, PagerDuty AIOps)          | noise reduction, alert grouping.  |
+-----------------------------------------------+-----------------------------------+
| Infrastructure & Cloud Monitoring             | Cluster health checks, resource   |
| (Prometheus, CloudWatch, Grafana)             | metrics, host performance.        |
+-----------------------------------------------+-----------------------------------+
| Workflow Automation Engines                   | Runbook orchestration, automated  |
| (Ansible, StackStorm, AWS Systems Manager)    | healing, self-service tasks.      |
+-----------------------------------------------+-----------------------------------+
Organizations generally take one of two operational approaches when choosing tools:
- Domain-Agnostic Ecosystems: Highly configurable correlation engines that collect data from any third-party monitor, cloud, or legacy infrastructure. They offer flexibility for hybrid environments but require continuous tuning and setup.
- Domain-Centric Ecosystems: Native analytics suites integrated directly into specific cloud providers or APM vendors. They offer out-of-the-box ML features but operate primarily within their own software ecosystem.
Step-by-Step AIOps Implementation Blueprint
Implementing an AIOps framework requires an incremental strategy focused on data quality, clear process guardrails, and gradual automation rollout.
Phase 1: Foundation
[Step 1: Audit Operations] ──> [Step 2: Unify Data Access] ──> [Step 3: Standardize Telemetry]
                                                                        │
Phase 2: Analytics & Correlation                                        ▼
[Step 6: Sync ITSM Workflows] <── [Step 5: Event Correlation] <── [Step 4: Dynamic Baselines]
       │
       ▼
Phase 3: Automation & Maturity
[Step 7: Low-Risk Automation] ──> [Step 8: Governance & Safety] ──> [Step 9: Iterative Scaling]
Step 1: Audit Current Operations and Identify Objectives
Map out existing operational friction points. Are engineers burning out from alert fatigue? Is your Mean Time to Resolution (MTTR) increasing? Define precise performance targets (such as reducing unactionable alerts by 50%) before selecting platforms.
Step 2: Unify Telemetry Sources
Catalog all active monitoring tools, log collectors, and infrastructure inventory lists. Secure network permissions and API credentials to allow centralized telemetry aggregation across all hosted environments.
Step 3: Enforce Standardized Telemetry Metadata
Deploy standard collection agents across your infrastructure. Require every metric, log line, and trace to include consistent metadata keys: service, owner, environment, and deployment_id.
Step 4: Deploy Dynamic Baseline Monitoring
Replace fixed thresholds on fluctuating performance indicators (e.g., system latency, network throughput) with statistical ML baselines. Tune sensitivity settings early to minimize false positives.
Step 5: Implement Topology-Aware Event Correlation
Connect your telemetry correlation engine to dynamic topology sources (CMDBs, cloud resource APIs, Kubernetes control planes). Configure correlation rules to cluster co-located alerts into unified incident tickets.
Step 6: Synchronize Incident Management Workflows
Route correlated incidents directly into your team’s ticketing and on-call tools. Ensure generated incidents include topology context, relevant log lines, and metric graphs to accelerate manual triage.
Step 7: Introduce Low-Risk Runbook Automation
Identify well-understood, repetitive tasks suitable for automation. Build runbooks for routine issues—such as clearing log caches, gathering diagnostic dumps, or restarting non-critical service instances—requiring manual approval during early stages.
Step 8: Define Security Controls and Feedback Loops
Apply strict Role-Based Access Control (RBAC) to all automated actions. Provide a simple mechanism for SREs to flag incorrect alert correlations, allowing underlying analytics models to be retrained over time.
Step 9: Measure Progress and Expand
Track operational performance metrics continuously: monitor MTTR trends, alert compression ratios, and automation success rates. Expand AIOps integrations to cover additional business applications as operational confidence grows.
Security, Governance, and Responsible AI Implementation
Delegating system analysis and operational actions to software introduces governance and security requirements that must be planned for in advance.
- Data Sanitization at Ingestion: Application logs often contain sensitive data like personally identifiable information (PII) or authentication tokens. Ingestion pipelines must scrub or mask sensitive strings before sending data to analytics engines.
- Comprehensive Audit Logging: Every automated remediation runbook must generate an immutable audit log detailing the trigger event, system context, executed commands, and final state changes.
- Human Oversight Guardrails: High-impact operational changes—such as database failovers, firewall rule edits, or large-scale resource deletions—must require explicit human confirmation.
- Model Retraining Cycles: Machine learning models trained on historical performance metrics can become outdated following major software deployments. Teams should schedule regular model retraining to keep predictions aligned with updated system baselines.
Common Implementation Pitfalls to Avoid
Even well-resourced engineering teams can run into roadblocks when implementing AIOps without clear boundaries.
- Neglecting Telemetry Hygiene: Feeding poor-quality, untagged, or incomplete telemetry into machine learning tools yields unreliable correlation predictions. Establishing clean data standards must come first.
- Automating Without Guardrails: Executing remediation scripts without rate limits or safety checks can turn minor issues into widespread outages. For instance, an automated script that restarts pods continuously during a database outage will create a cascading fail loop.
- Treating AI as a Replacement for Operational Expertise: AIOps is designed to assist engineering teams, not replace domain knowledge. While algorithms excel at finding patterns across high-volume data streams, human engineers are still needed to assess business risks and solve novel architectural issues.
- Attempting Full-Stack Deployment Immediately: Trying to roll out machine learning models across an entire enterprise infrastructure simultaneously usually causes tool confusion and administrative overload. Start with a single core service, refine correlation rules, and expand iteratively.
Decision-Making Framework
Use this structured decision guide when evaluating AIOps platforms, tools, or architectural strategies:
- Target Problem Identification: Are you trying to reduce alert noise, speed up root-cause triage, or automate routine operational tasks?
- Ingestion Capability Audit: Can the platform ingest your current metrics, logs, traces, and topology maps without requiring custom development work?
- Integration Assessment: Does the platform connect natively with your existing ITSM tools, CI/CD pipelines, and alerting mechanisms?
- Algorithmic Transparency: Does the tool clearly explain why it correlated an incident, providing underlying telemetry graphs rather than operating as a black box?
- Automation Safety Review: Does the execution engine support dry-run modes, approval steps, execution rate limits, and rollback options?
- Compliance and Security Verification: Does the vendor meet your enterprise compliance requirements (SOC 2, HIPAA, GDPR) for processing system telemetry?
- Proof-of-Concept Replay: Run candidate platforms against historical incident data streams to evaluate real-world alert compression performance and anomaly detection accuracy before committing.
The Evolution of AIOps
As modern cloud infrastructure evolves, emerging technologies are shifting how teams approach Artificial Intelligence for IT Operations:
- Generative AI for Incident Management: Large Language Models (LLMs) are being integrated into triage pipelines to summarize incident timelines, interpret raw stack traces into clear descriptions, and draft initial post-mortem documents.
- Conversational Incident Interfaces: Interactive ChatOps bots allow engineers to query system observability platforms using natural language—for example, asking “Which deployments in us-west-2 caused latency spikes in the last hour?”
- Platform Engineering Integration: Platform engineering teams are embedding AIOps capabilities directly into internal developer portals, offering developers self-service diagnostic insights for their applications.
Practical Takeaways
- Prioritize Telemetry Structure: A successful AIOps deployment starts with clean, standardized telemetry. Require consistent metadata tagging across all metrics, logs, and traces.
- Target Noise Suppression First: Implement temporal and topology-based event correlation early to consolidate alert storms into actionable, high-context incident tickets.
- Maintain Safety Controls: Keep human engineers in the loop for high-risk decisions, and restrict automated runbooks to well-defined, low-risk operational tasks.
- Track Actionable Metrics: Evaluate success using clear operational metrics, such as Mean Time to Resolution (MTTR), alert reduction ratios, and engineer on-call load.
- Invest in Team Upskilling: Building modern observability capabilities requires ongoing learning. Technical professionals can explore practical educational resources, career guides, and industry frameworks at TheAIOps to build modern AIOps skills.
Frequently Asked Questions (FAQs)
1. What is AIOps?
AIOps stands for Artificial Intelligence for IT Operations. It uses machine learning, big data analytics, and automation to help operations teams aggregate telemetry, suppress alert noise, correlate incidents, identify root causes, and automate routine infrastructure maintenance.
2. How does AIOps differ from traditional IT monitoring?
Traditional monitoring relies on fixed thresholds on individual hosts (e.g., raise an alert if CPU exceeds 85%). AIOps ingests telemetry across all infrastructure layers, using machine learning to build dynamic baselines, identify complex anomaly patterns, and correlate related events across distributed systems.
3. Why is operational telemetry critical to an AIOps architecture?
Telemetry—comprising metrics, logs, traces, and topology graphs—provides the foundational data required by an AIOps platform. Clean, structured telemetry allows machine learning models to detect anomalies accurately and map relationships across complex application environments.
4. Can AIOps runbooks automatically fix production incidents?
Yes, AIOps platforms can execute automated remediation runbooks for well-understood, low-risk operational tasks (such as clearing temp files or restarting non-critical container pods), provided safety guardrails and rate limits are in place.
5. How does Observability differ from AIOps?
Observability focuses on capturing and exposing system state output via metrics, logs, and traces so engineers can analyze system behavior. AIOps applies machine learning and analytics to that observability data to automate alert correlation, detect anomalies, and execute remediation workflows.
6. What core skills are required for an AIOps Engineer?
An AIOps engineer typically combines SRE and DevOps experience, cloud infrastructure knowledge, observability expertise, programming skills (such as Python or Go), and a practical understanding of time-series analytics and machine learning applications.
7. How does event correlation reduce on-call alert fatigue?
Event correlation groups hundreds of individual alerts triggered during a single service disruption into one structured incident ticket. This suppresses alert storms, giving on-call engineers clear context regarding the root cause rather than a wall of duplicate notifications.
8. What are common failure modes in AIOps implementations?
Common pitfalls include feeding dirty or untagged telemetry into analytics tools, attempting to automate complex tasks without safety guardrails, deploying tools without clear operational goals, and treating AI platforms as a complete replacement for human operational expertise.
9. How should an organization select an AIOps tool?
Organizations should evaluate AIOps tools based on telemetry ingestion capabilities, topology mapping integration, machine learning transparency, compatibility with existing ITSM and alerting systems, and built-in safety controls for automated remediation.
10. Where can I access structured training for AIOps?
Learning hubs like TheAIOps offer technical guides, implementation frameworks, and practical educational resources designed to help engineers and technology leaders build expertise in AIOps, observability, and intelligent operations.
Conclusion
Building a modern enterprise AIOps architecture provides a practical framework for managing complex, distributed cloud environments. By organizing telemetry ingestion, data parsing, machine learning correlation, and automated runbooks into clear operational layers, organizations can convert high-volume telemetry noise into actionable insights.A resilient AIOps environment does not rely on marketing promises or a single platform. Instead, it requires structured data standards, accurate dependency mapping, robust security controls, and a commitment to iterative operational improvements. When designed with these core engineering principles, an AIOps architecture enables SREs, DevOps engineers, and IT operations teams to resolve outages faster, reduce repetitive toil, and keep critical business applications running smoothly.
Leave a Reply